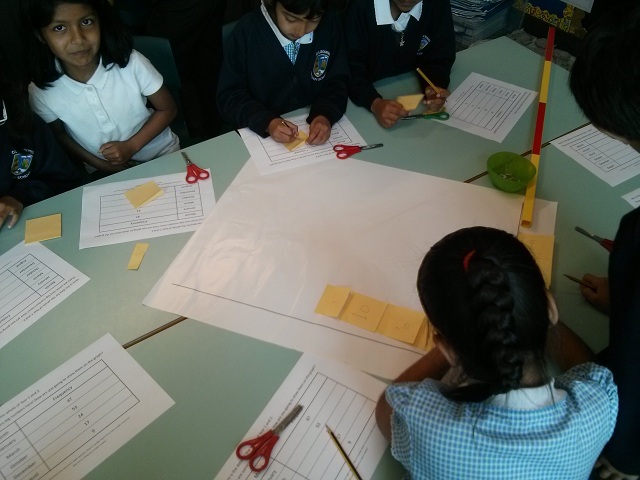
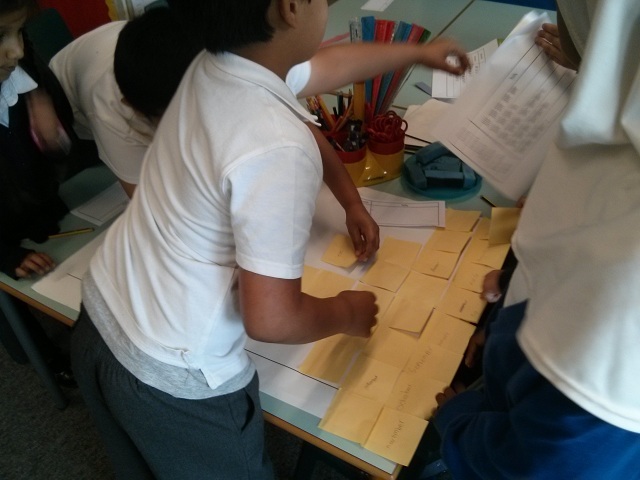
In this activity, Year 2 were challenged to represent some data using axes, post-it notes and a little bit of problem solving!
It started out easily enough, but soon the numbers get so big that we couldn’t fit all of our data onto the graph using 1 post-it per person.
Oh no! What do you think they might have done to overcome this issue?


Post-it Graphs
